The Question
How do you measure a city's greenness?
You could walk every street, count every tree, survey every park. It would take years.
Or you could ask a satellite...
A journey from satellite orbit to urban vegetation maps
How do you measure a city's greenness?
You could walk every street, count every tree, survey every park. It would take years.
Or you could ask a satellite...
The European Space Agency operates two identical satellites that photograph Earth's entire land surface every five days. The data is completely free and open - funded by European taxpayers for everyone to use.
The left image shows what humans see - red, green, and blue light combined. The right shows near-infrared, where healthy vegetation glows bright red.
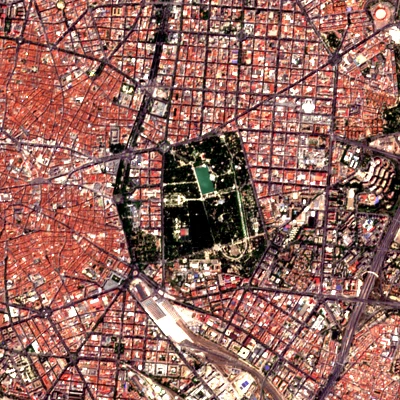
What your eyes would see from space. Retiro Park appears as a muted green patch.
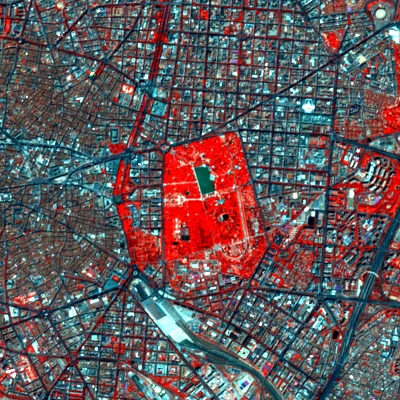
Vegetation reflects NIR strongly, appearing bright red. Buildings and roads stay dark.
Sentinel-2 sees light we can't. Near-infrared light bounces off healthy plants like a mirror - they reflect about 50% of it. Concrete and asphalt? Only about 20%.
To human eyes, this light is invisible. To the satellite, it's the key to finding every patch of green in a city.
We combine the near-infrared and red bands into a single number called NDVI (Normalized Difference Vegetation Index).
One image isn't enough. Clouds block the view. Shadows confuse the readings. We need multiple cloud-free observations to build a reliable picture.

We collect all summer observations (June-August) and keep only the clear ones.
From all the cloud-free observations, we calculate the median value for each pixel. This gives us a clean, representative view of vegetation at its peak.
Think of it like taking a burst of photos and keeping the best frame - except we're combining dozens of satellite passes into one perfect image.
NDVI values range from -1 to +1. We need to decide: what counts as "vegetated"?
Not counted as vegetation. Includes roads, buildings, bare soil, water, and sparse or stressed plants.
Counted as vegetation. Healthy trees, dense grass, parks, gardens - anything actively photosynthesizing.
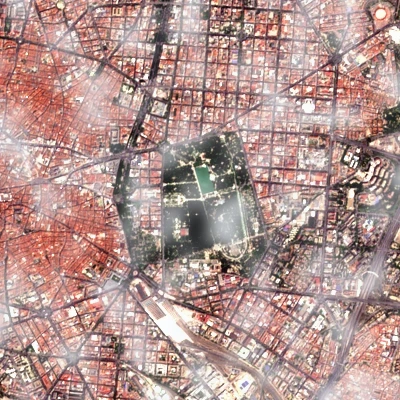
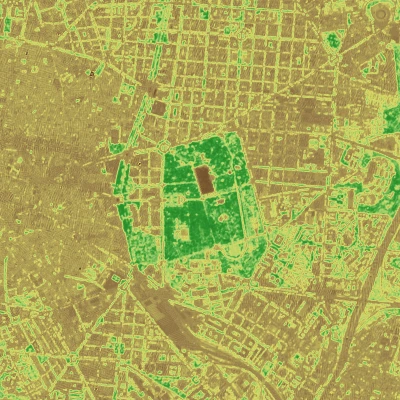
From raw satellite bands to a vegetation map. The NDVI image shows the gradient, while the mask shows the final classification.
Brown = low NDVI (urban), Green = high NDVI (vegetation). Retiro Park stands out clearly.
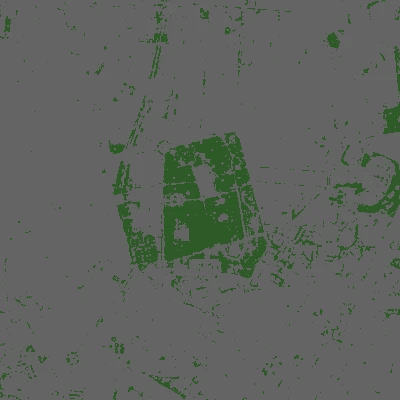
Green = NDVI above 0.40 (counted as vegetation). Gray = below threshold.
The result: a pixel-by-pixel map of urban vegetation. Every 10m square is classified as vegetated or not.
We've processed satellite imagery for cities across 27 EU countries. Every city measured the same way, with the same data, using the same methods.