
How green is Nijmegen?
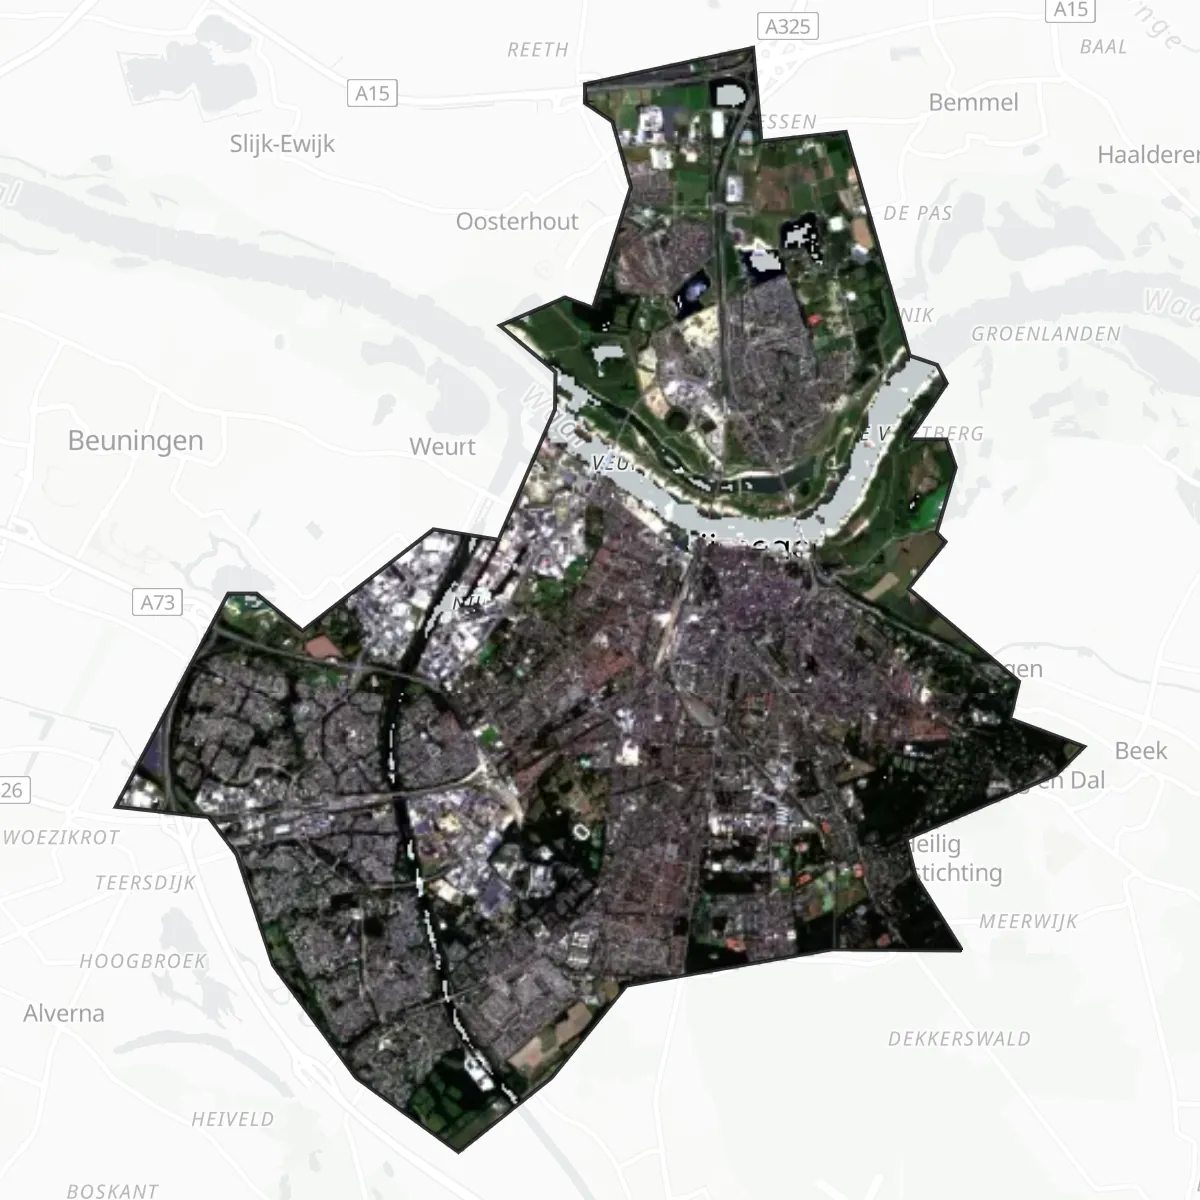
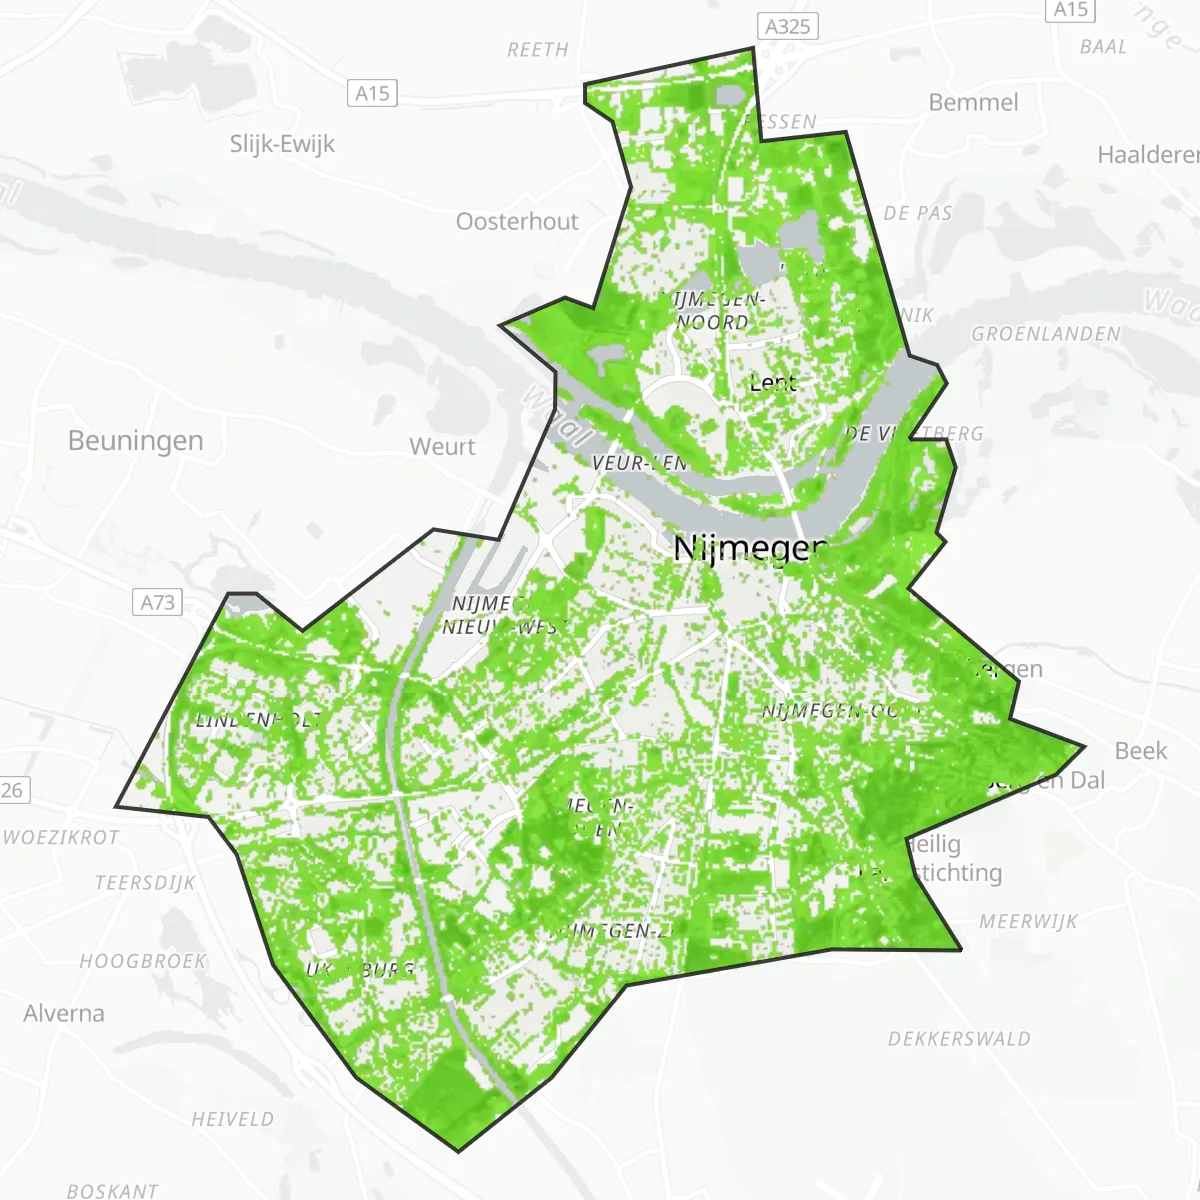
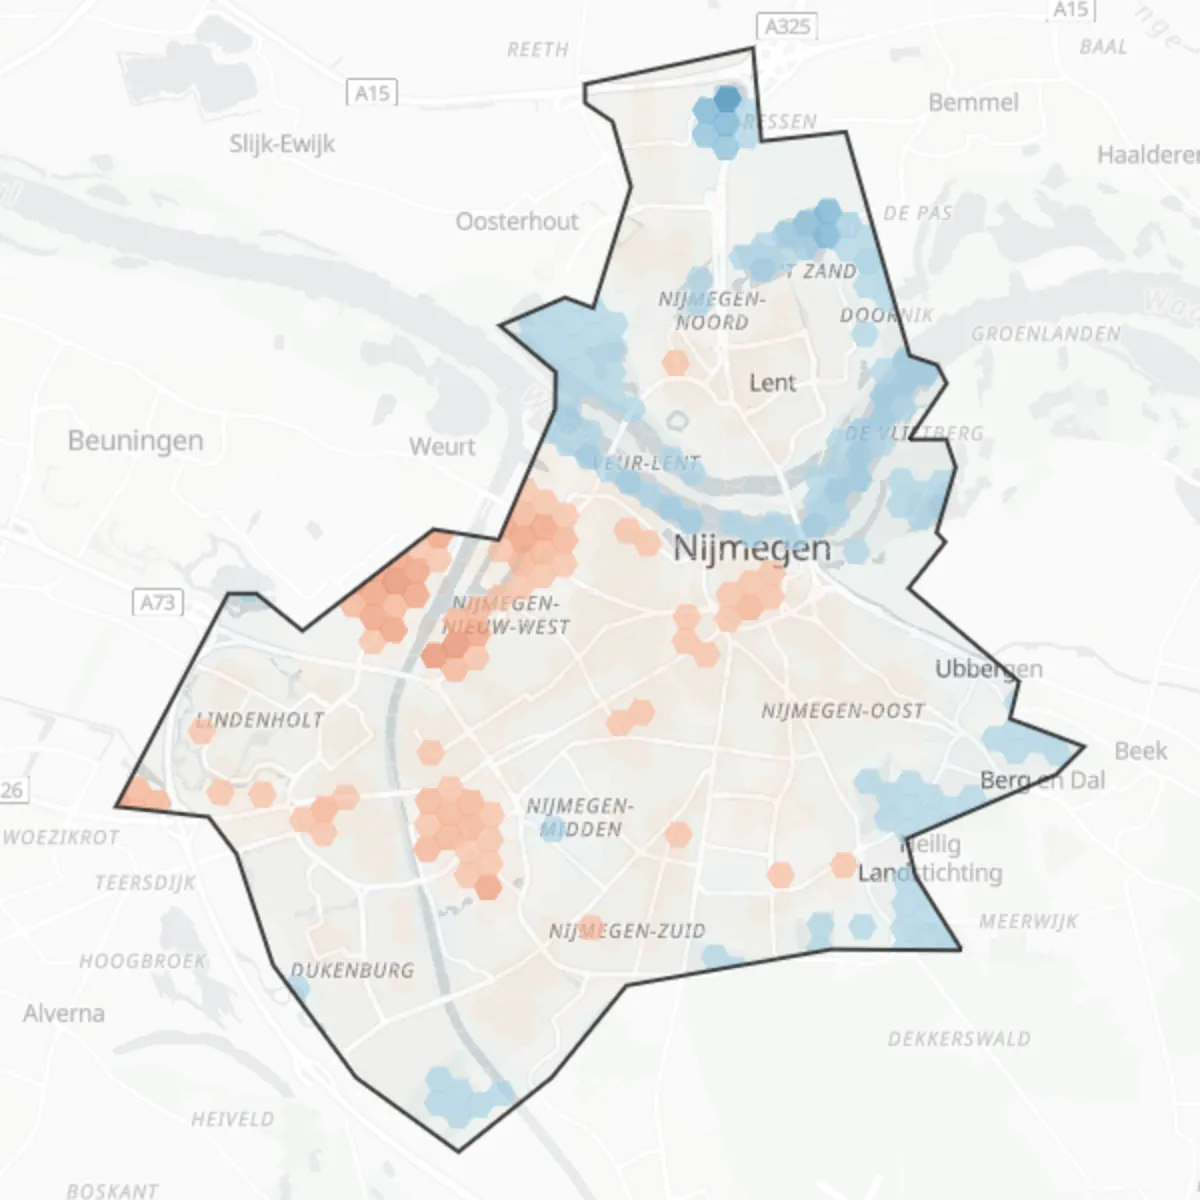
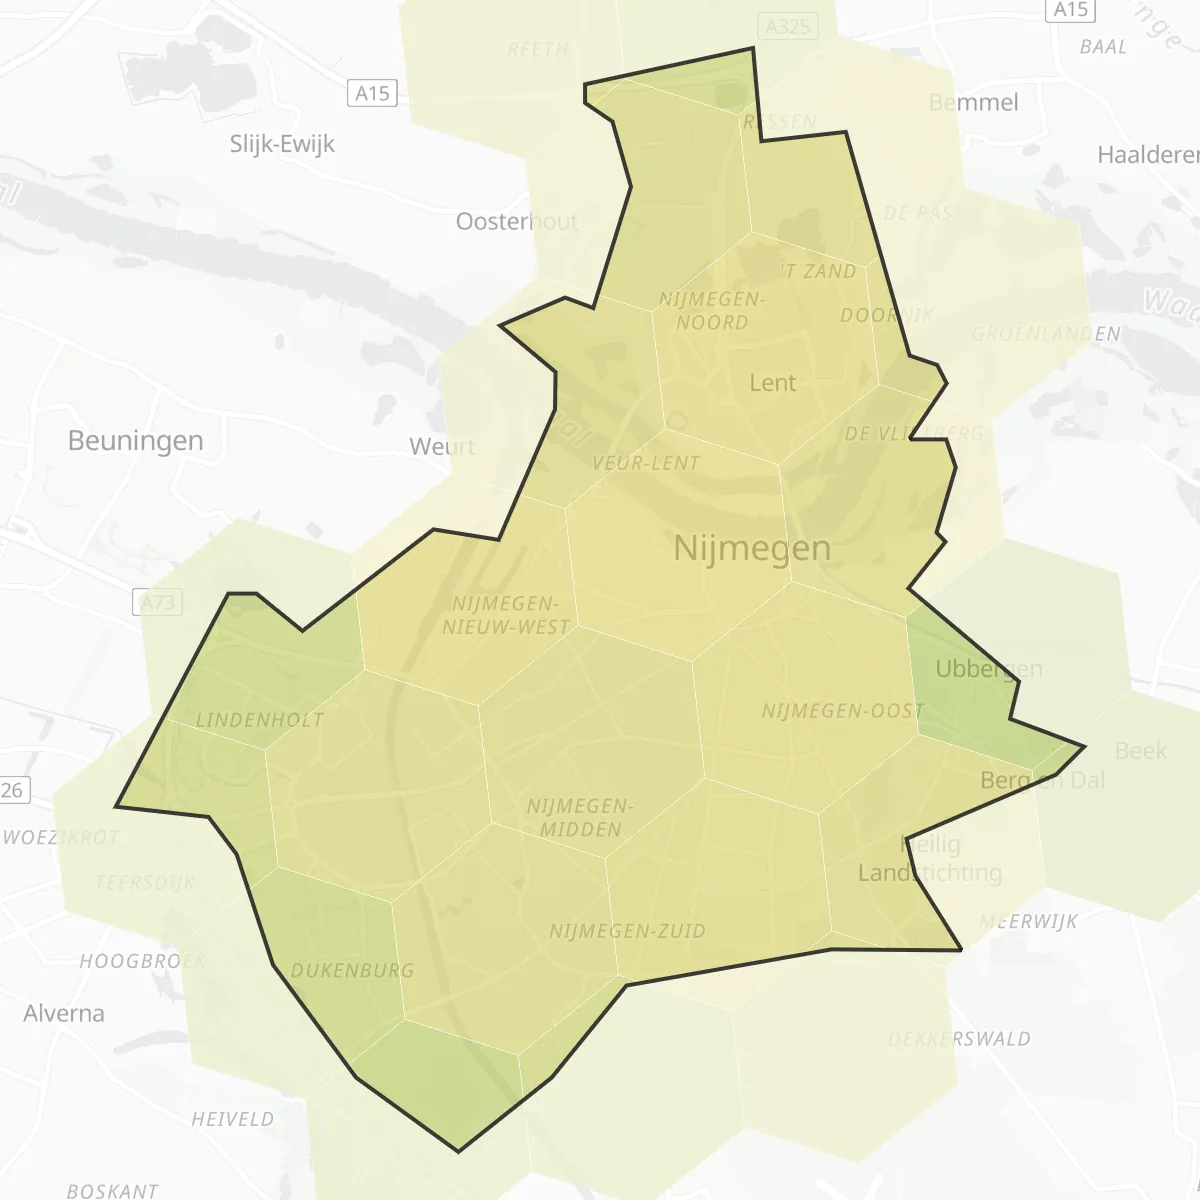
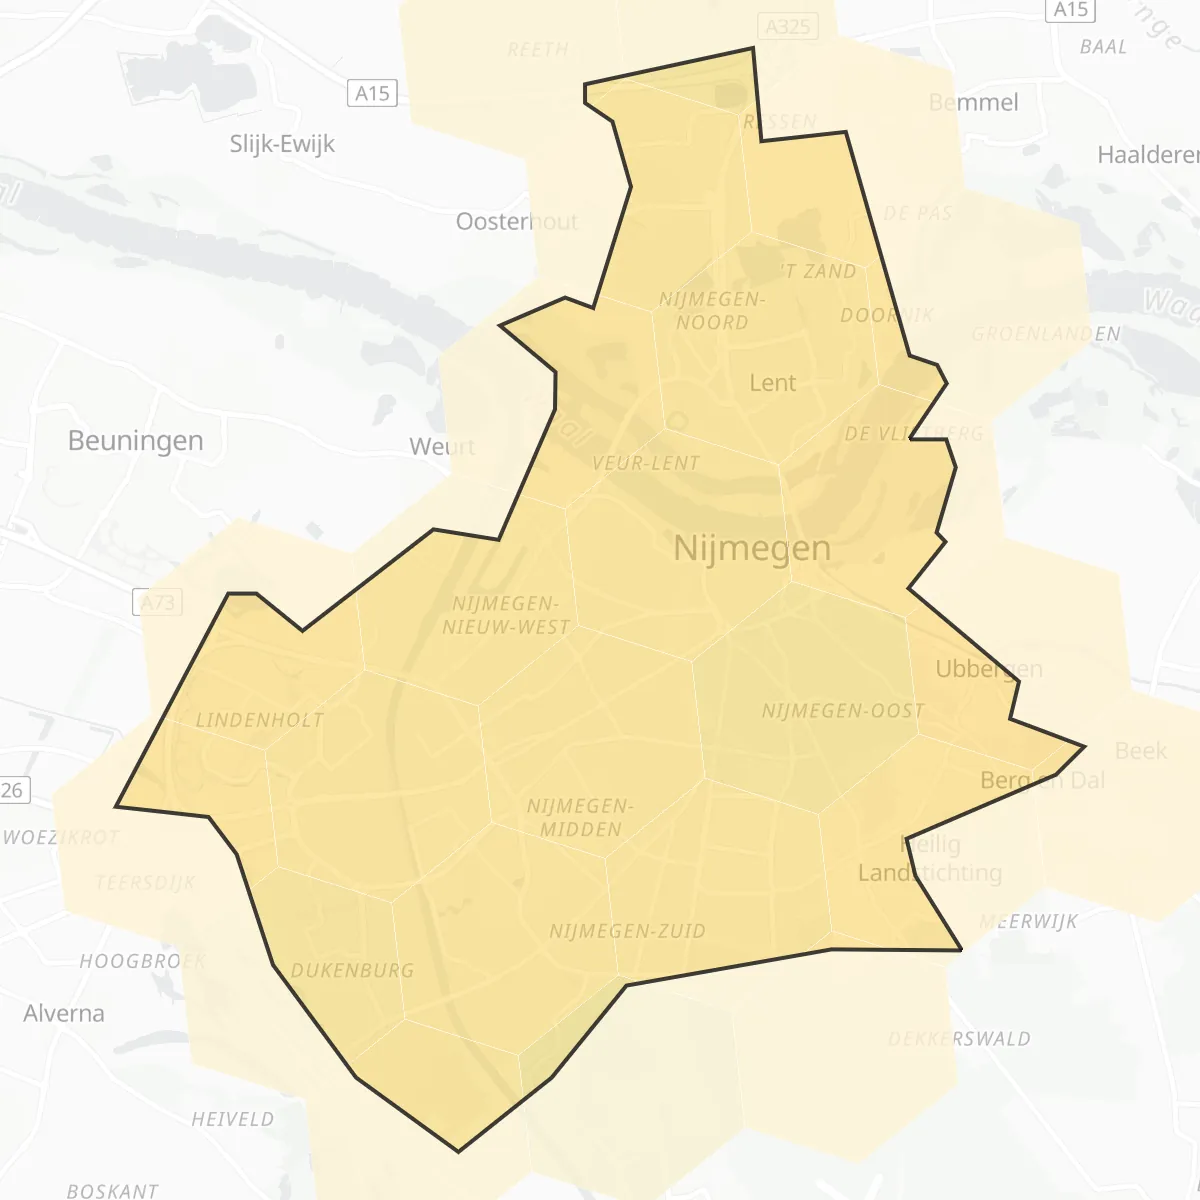
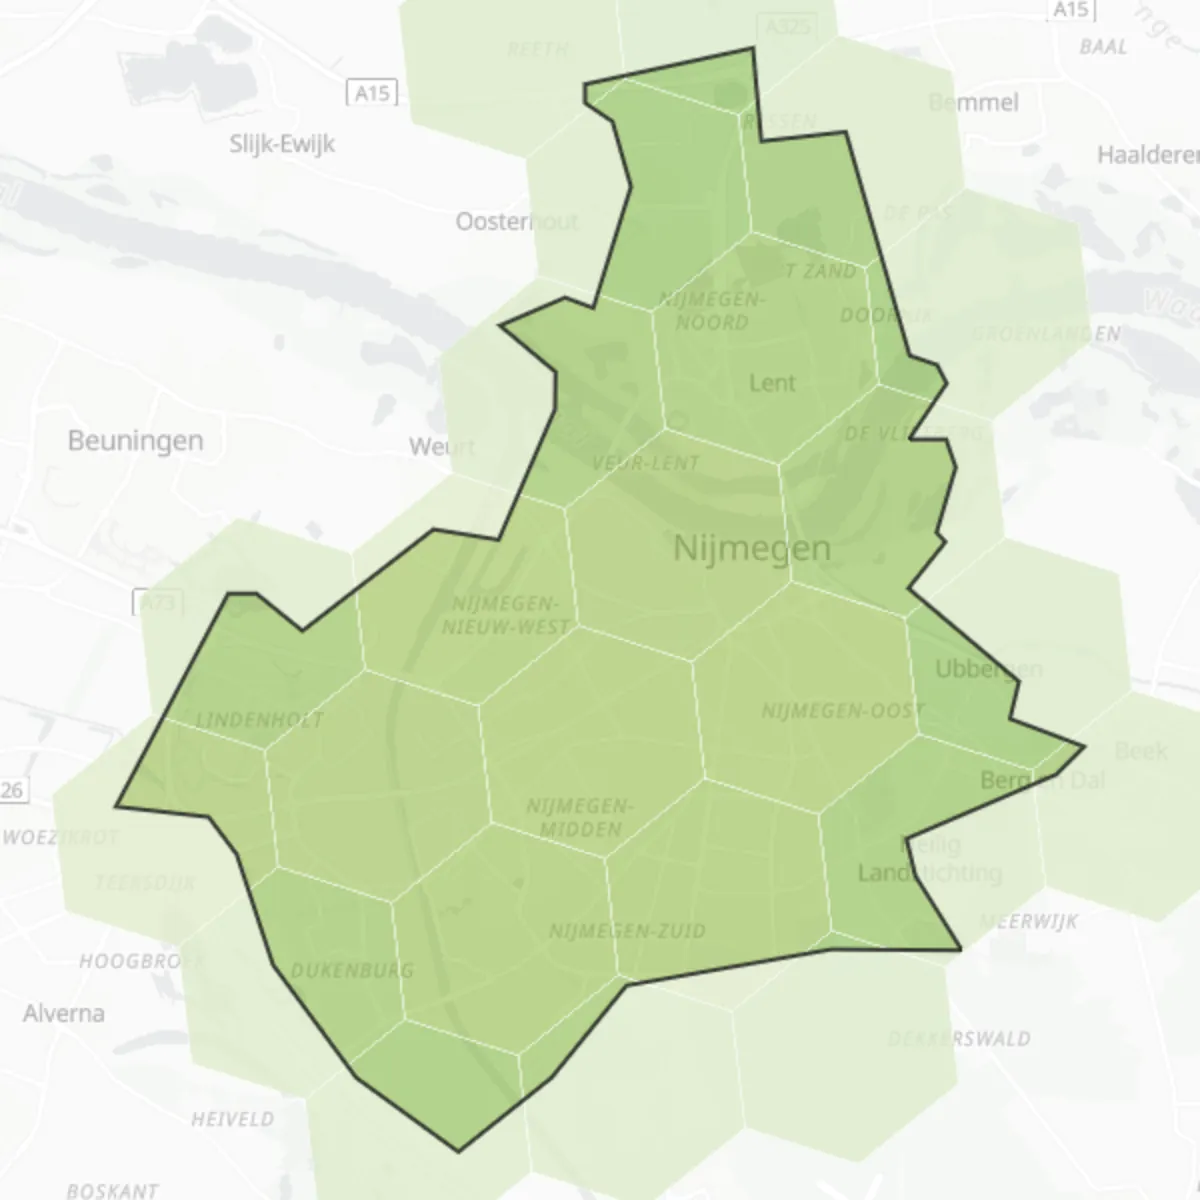
Nijmegen has 111 square metres of green space per inhabitant in 2025 satellite data. Vegetation covers 35% of the city area. In summer, the hottest land surface zones sit 3.5 °C above the city-wide average (land surface temperature, not air temperature). The PM2.5 model estimate for 2025 is 9.9 µg/m³. Satellite records cover 8 years, 2018 to 2025. Overall, Nijmegen ranks #480 of 828 reviewed cities in the Green City Index (green space, land surface heat and air quality combined), and #50 of 56 in Netherlands.
111
m² green per inhabitant
35%
vegetation cover
+3.5 °C
hottest zones vs city mean
9.9
PM2.5 estimate µg/m³
17.2
PM10 estimate µg/m³
17.5
NO2 estimate µg/m³
444.3
Index · #480/828
City maps
Nearby in the rankings
This city is at position #480 of 828 worldwide.
| #rank | City | Country | Index |
|---|---|---|---|
| 477 | Crotone | Italy | 444.0 |
| 478 | Parma | Italy | 444.0 |
| 479 | Ludwigshafen am Rhein | Germany | 444.3 |
| 480 | Nijmegen | Netherlands | 444.3 |
| 481 | Manfredonia | Italy | 445.2 |
| 482 | Cergy | France | 445.8 |
| 483 | Prešov | Slovakia | 445.8 |
Method and caveats
Heat is land surface temperature, not air temperature. Air quality values are model estimates. Green area is vegetation extent detected by satellite, not tree height.

